Chapter 22 Tabular Representation of Statistical Data RD Sharma Solutions Exercise 22.2 Class 9 Maths

Chapter Name | RD Sharma Chapter 22 Tabular Representation of Statistical Data Exercise 22.2 |
Book Name | RD Sharma Mathematics for Class 10 |
Other Exercises |
|
Related Study | NCERT Solutions for Class 10 Maths |
Exercise 22.2 Solutions
1. Define cumulative frequency distribution.
Solution
Cumulative frequency distribution: A table which displays the manner in which cumulative frequencies are distributed over various classes is called a cumulative frequencies (or) cumulative frequencies distribution table.
2. Explain the difference between a frequency distribution and a cumulative frequency distribution.
Solution
Frequencies table or frequency distribution is a method to represent raw data in the form from which one can easily understand the information contained in a raw data , where as a table which plays the manner in which cumulative frequencies are distributed over various classes is called a cumulative frequency distribution.
3. The marks scored 55 students in a test are given below:
|
Marks |
0 – 5 |
5 – 10 |
10 – 15 |
15 – 20 |
20 – 25 |
25 – 30 |
30 – 35 |
|
No. of students |
2 |
6 |
13 |
17 |
11 |
4 |
2 |

|
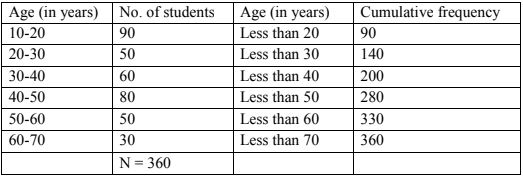
Age (in years): |
10 – 20 |
20 – 30 |
30 – 40 |
40 – 50 |
50 – 60 |
60 – 70 |
|
No. of Patients : |
90 |
50 |
60 |
80 |
50 |
30 |

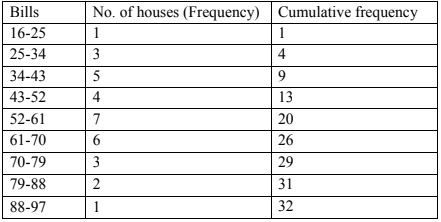
Maximum bill is Rs 95.
Range = Maximum bill - minimum bill
Given class in terval is 70 - 79, So class size
∴ Number of classes = Range/class size = 71/9 = 7.88
∴ Number of classes = 8
The cumulative frequency distribution table is as

Range = maximum B.S - Minimum B.S
Given class interval = 45 - 49. So class size
= 49 - 45 = 4
∴ Number of classes = Range/Class size = 29/4 = 7.25
⇒ Number of classes = 8.
The cumulative frequencies distribution is as

|
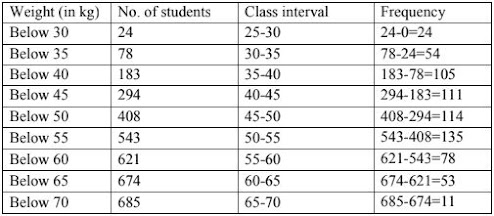
Weight (in kg) |
No. of students |
|
Below 25 |
0 |
|
Below 30 |
24 |
|
Below 35 |
78 |
|
Below 40 |
183 |
|
Below 45 |
294 |
|
Below 50 |
408 |
|
Below 55 |
543 |
|
Below 60 |
621 |
|
Below 65 |
674 |
|
Below 70 |
685 |

|
Consumption(in kW) |
No. of Factories |
|
Below 240 |
1 |
|
Below 270 |
4 |
|
Below 300 |
8 |
|
Below 360 |
24 |
|
Below 390 |
38 |
|
Below 420 |
40 |

|
Ace in years |
No. of persons |
|
Above 108 |
0 |
|
Above 96 |
1 |
|
Above 84 |
3 |
|
Above 72 |
5 |
|
Above 60 |
20 |
|
Above 48 |
158 |
|
Above 36 |
427 |
|
Above 24 |
809 |
|
Above 12 |
1026 |
|
Above 0 |
1124 |

